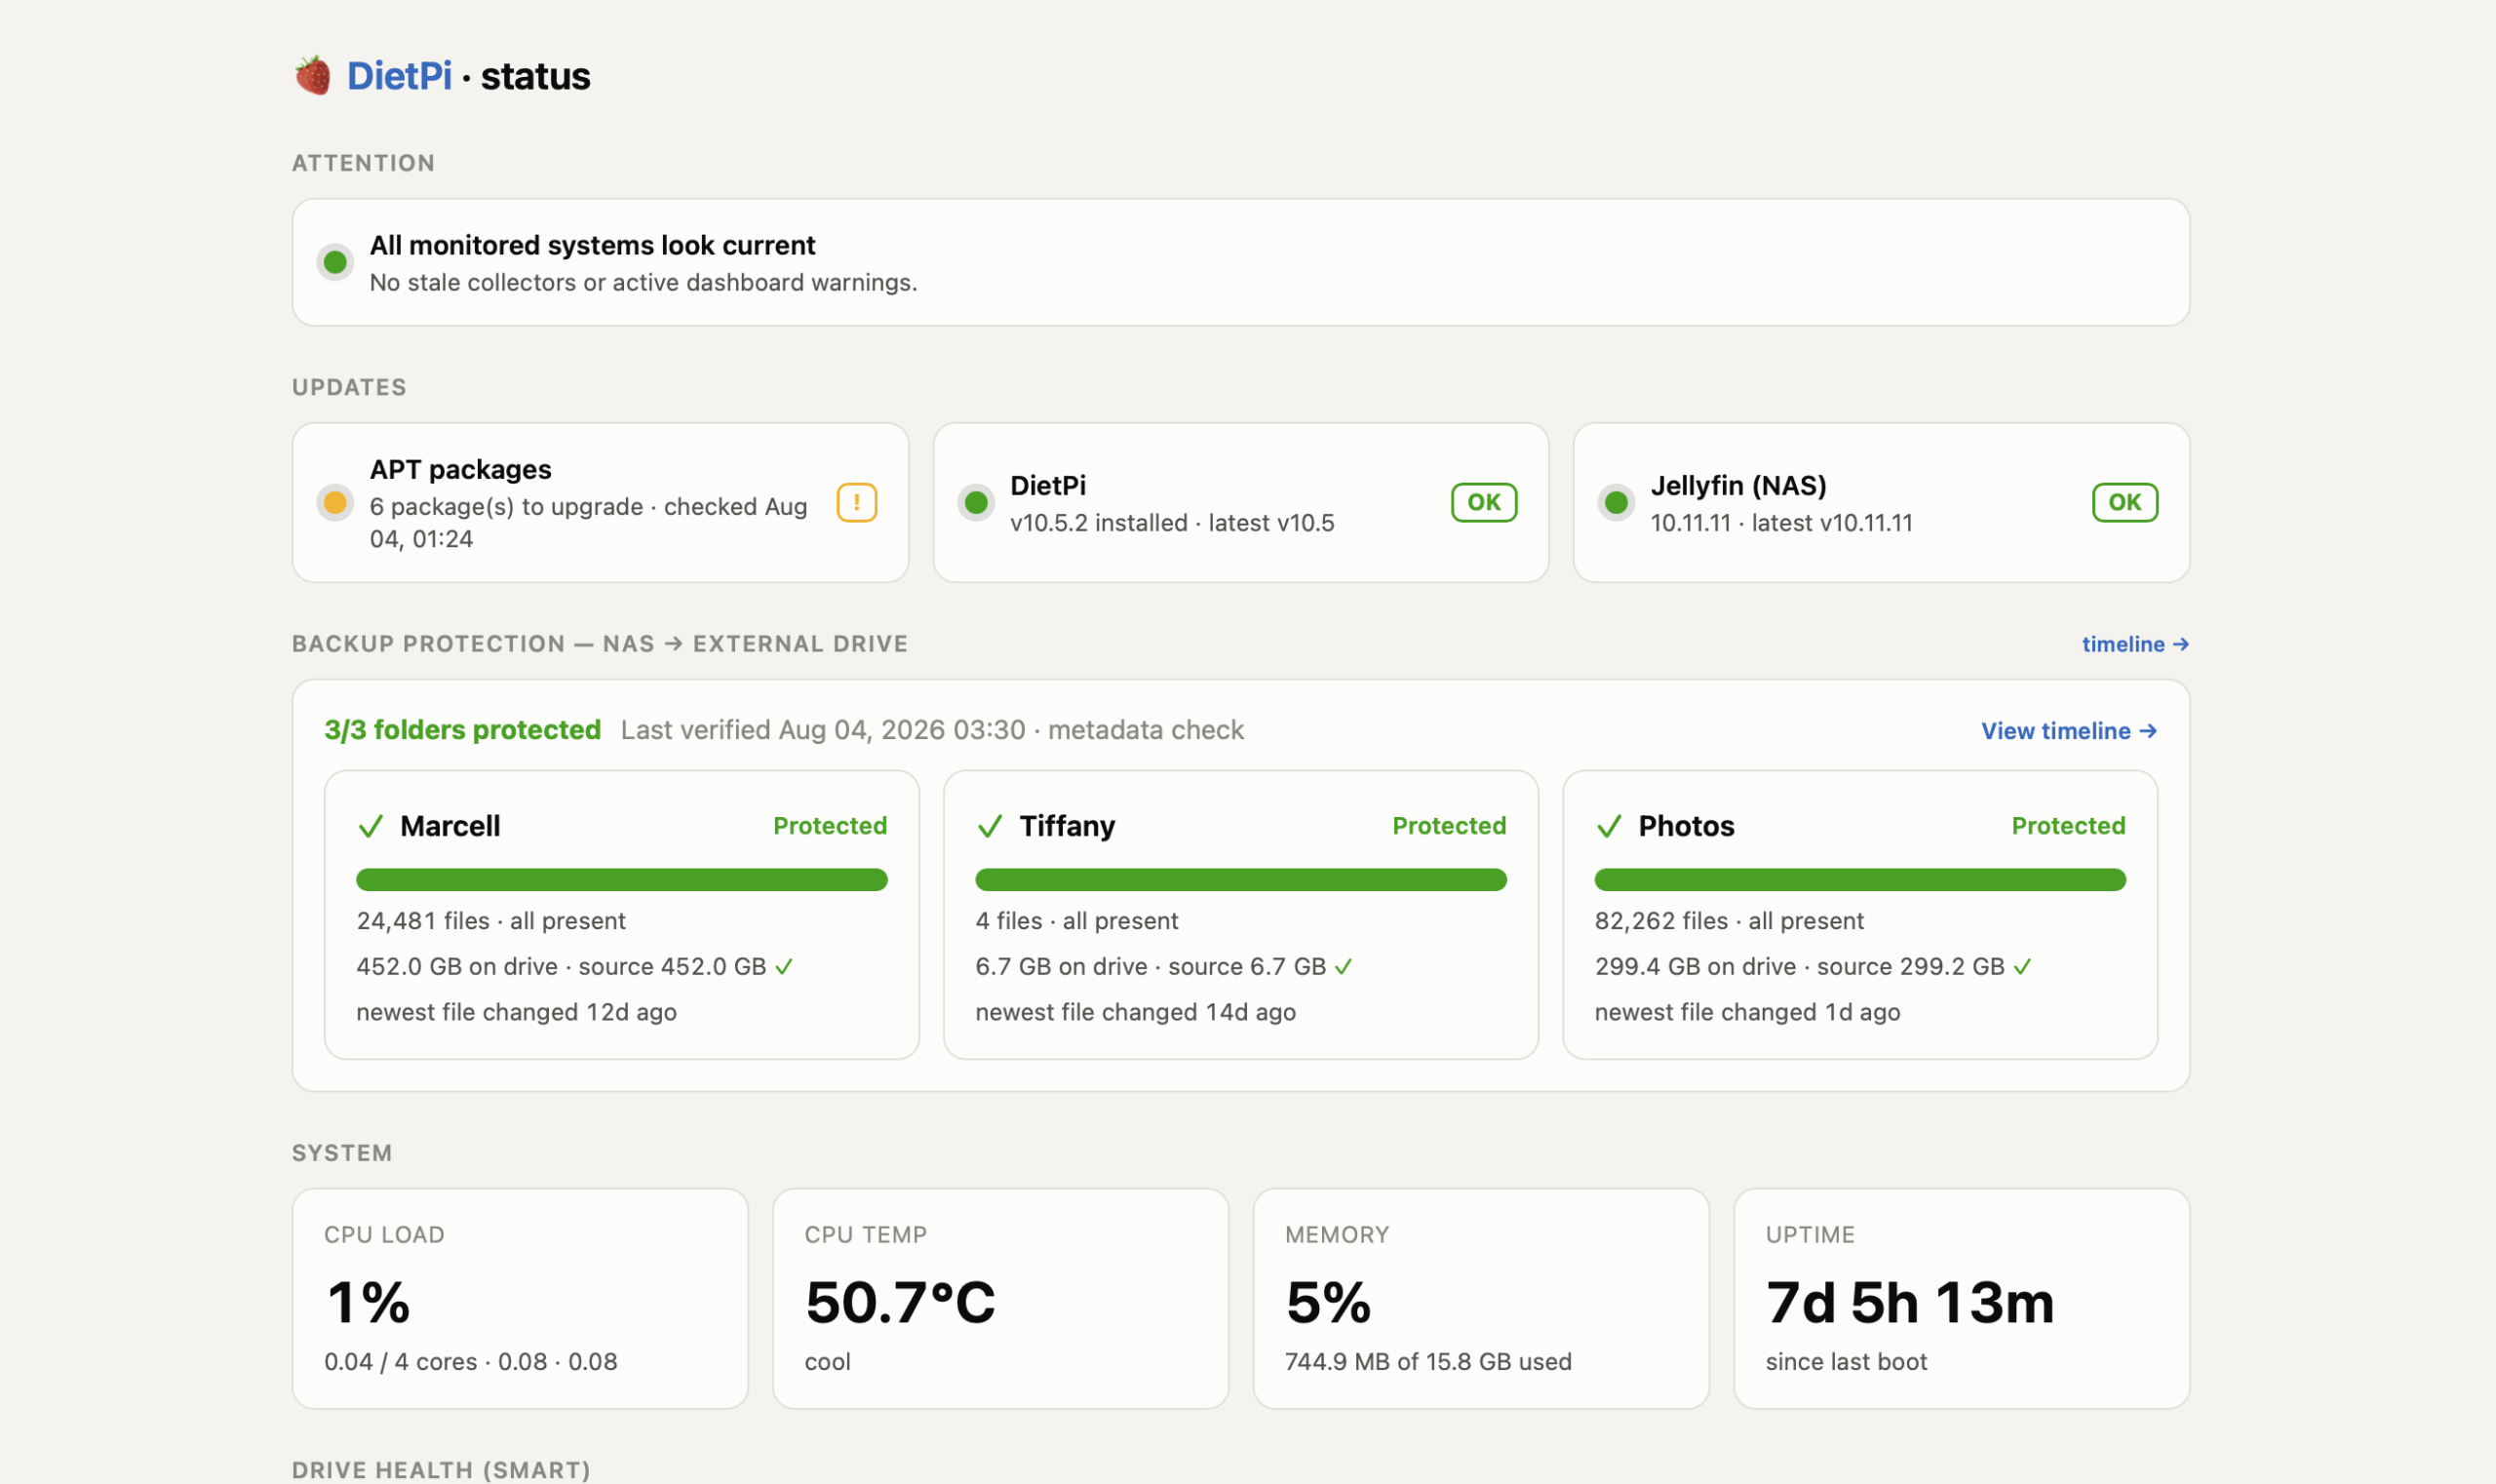
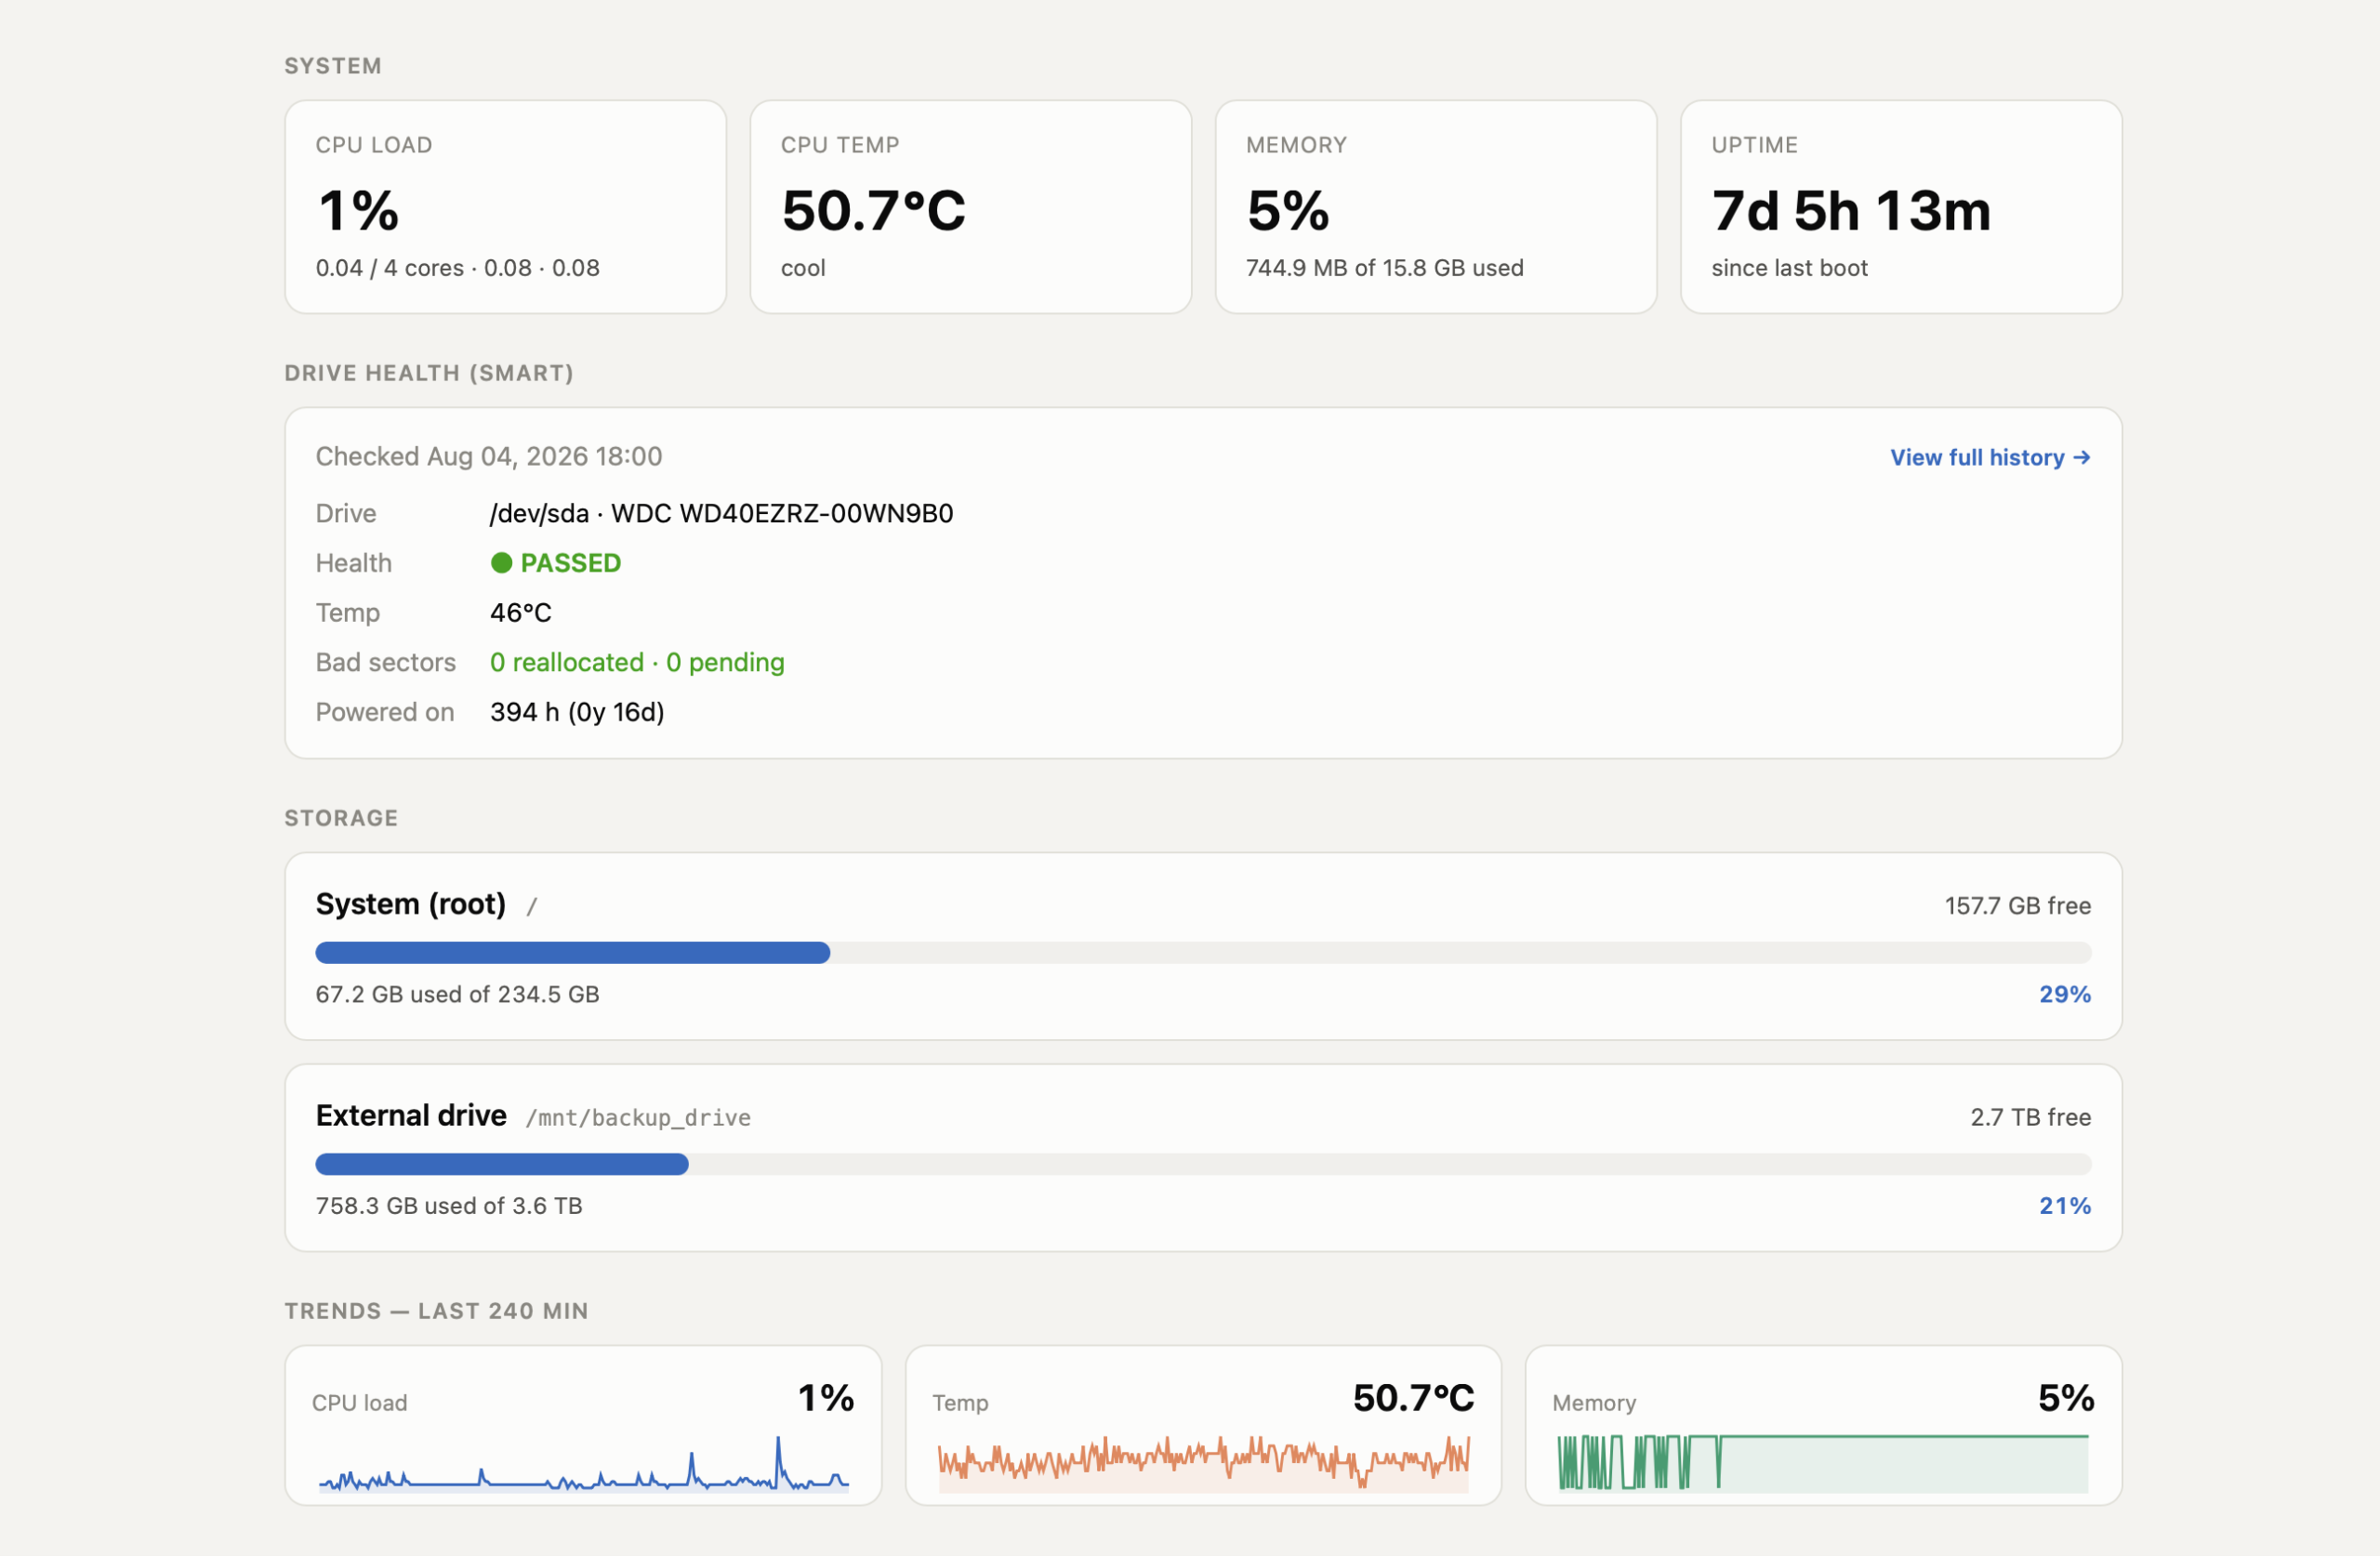
The first version was just a status page. It showed CPU load, memory, storage, temperature, and uptime. From there I added SMART checks for the drive, Docker status, network discovery, backup comparisons, and Jellyfin information.
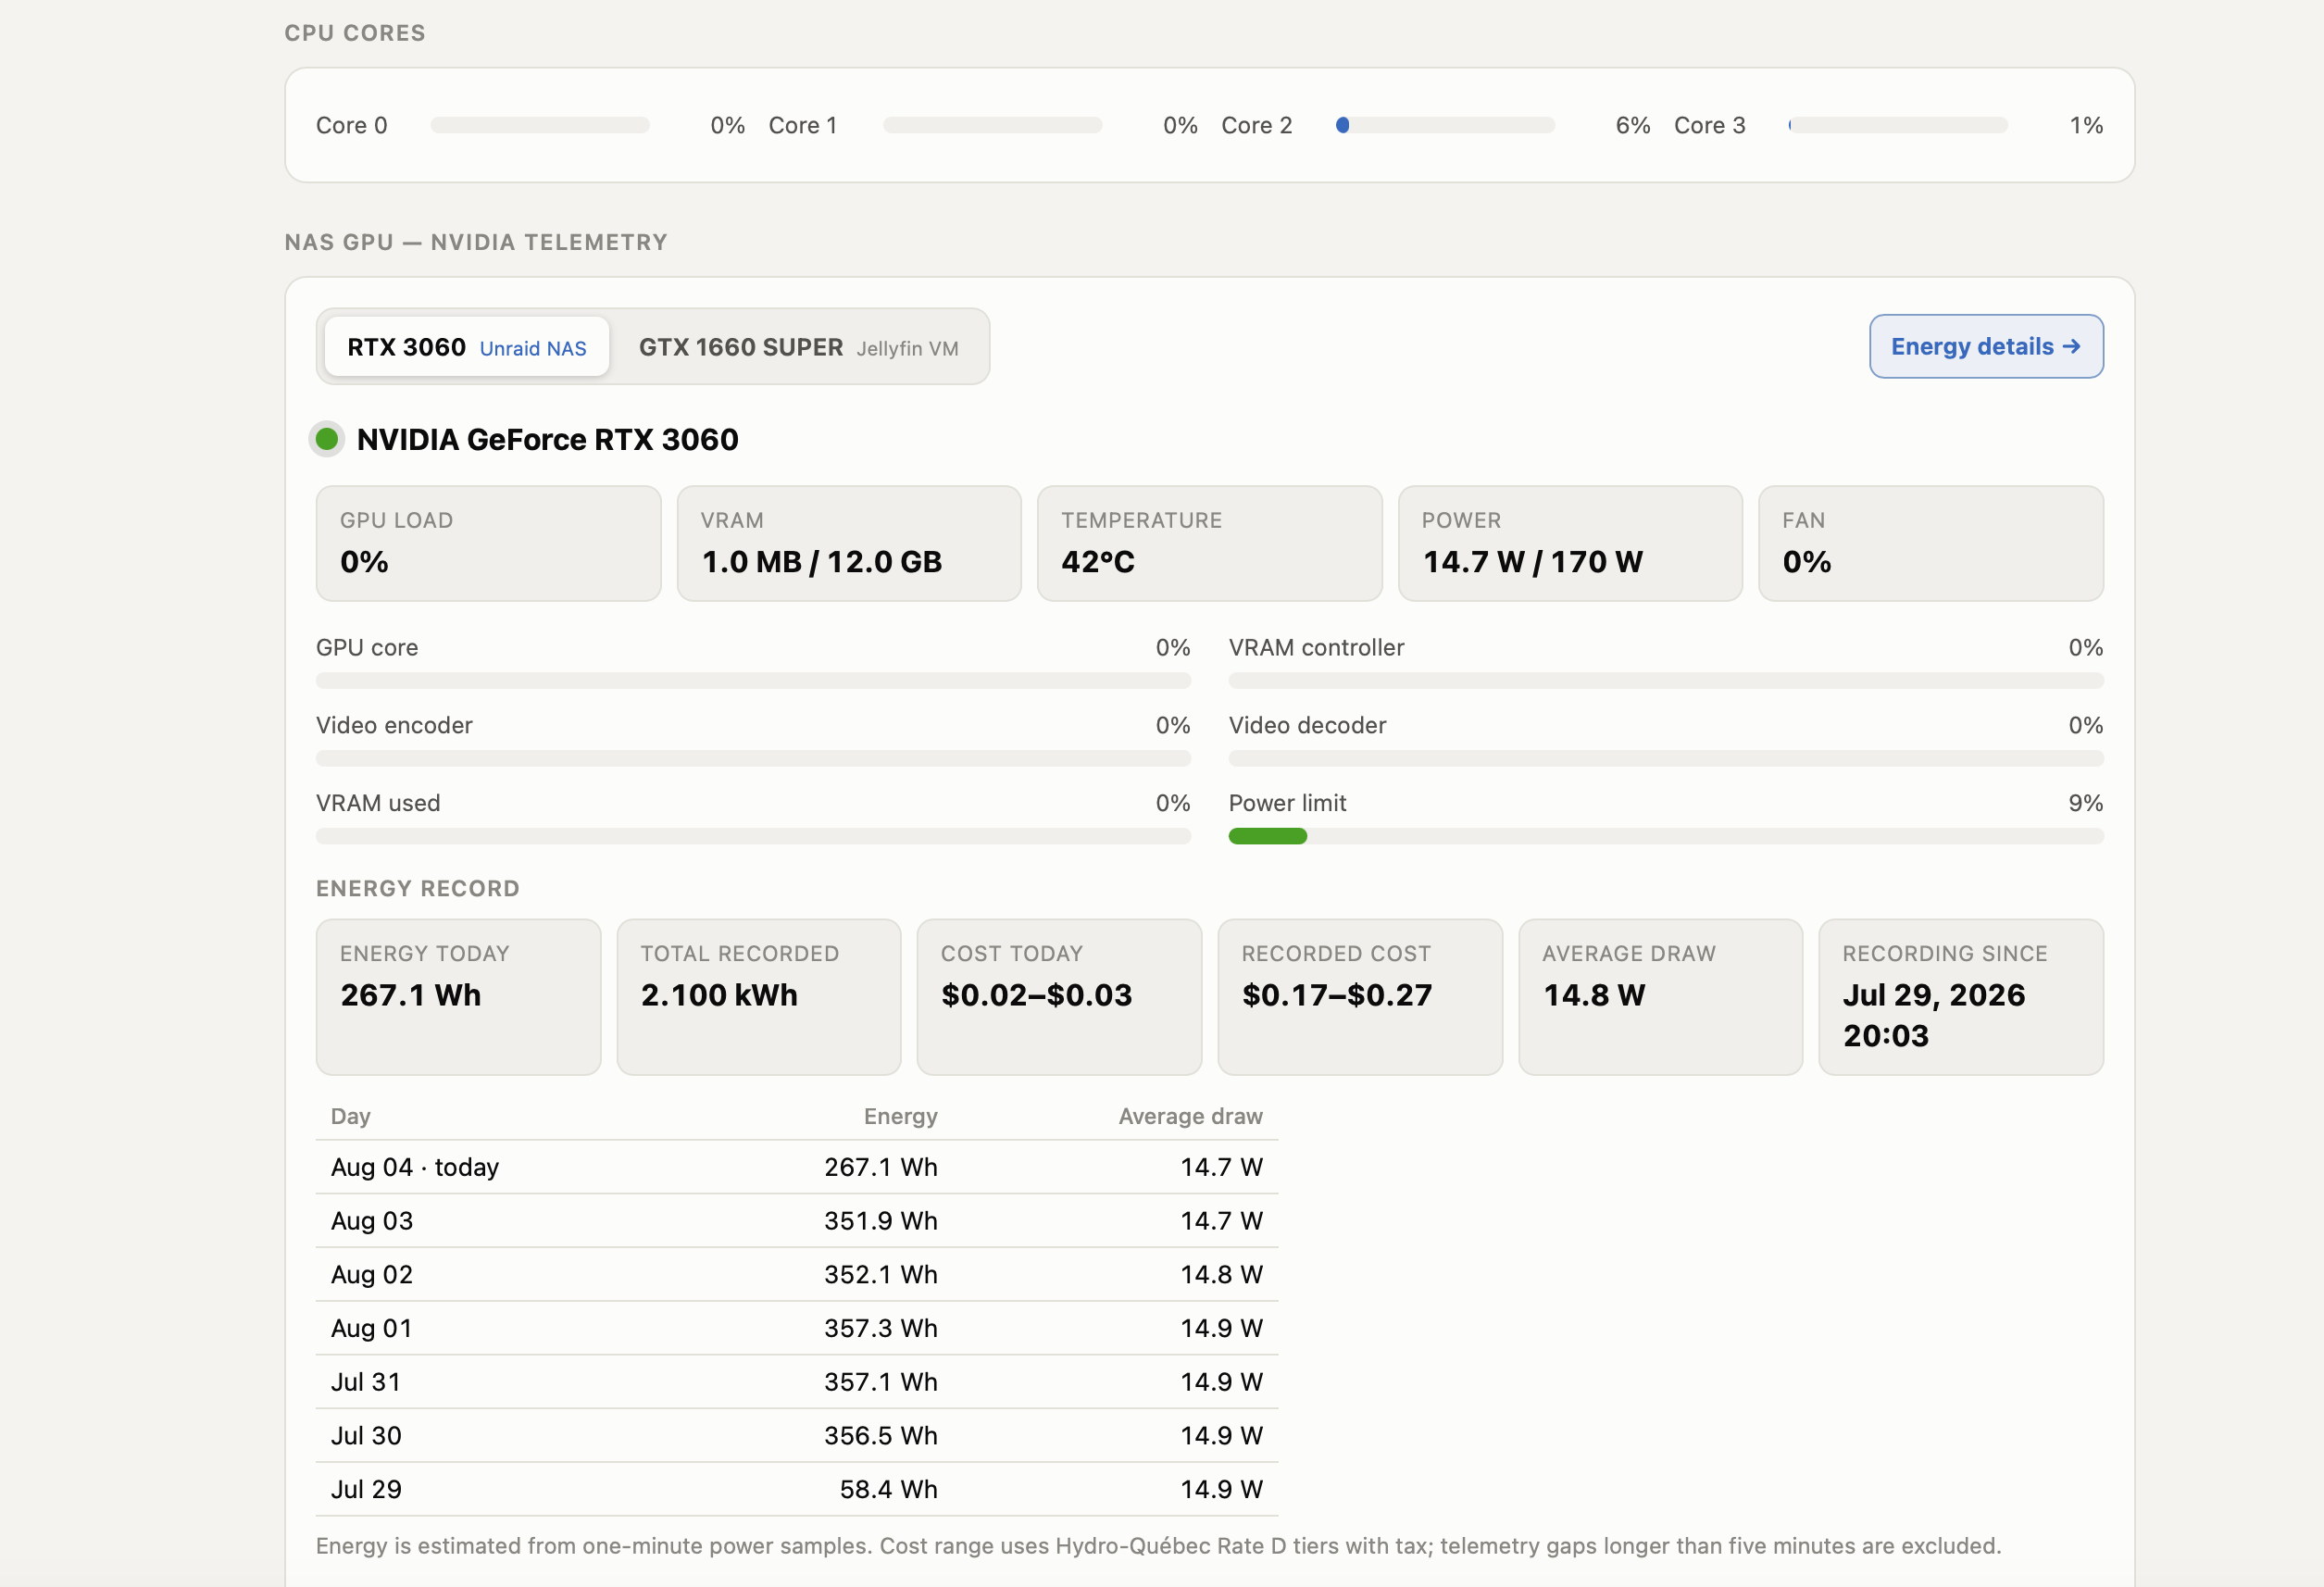
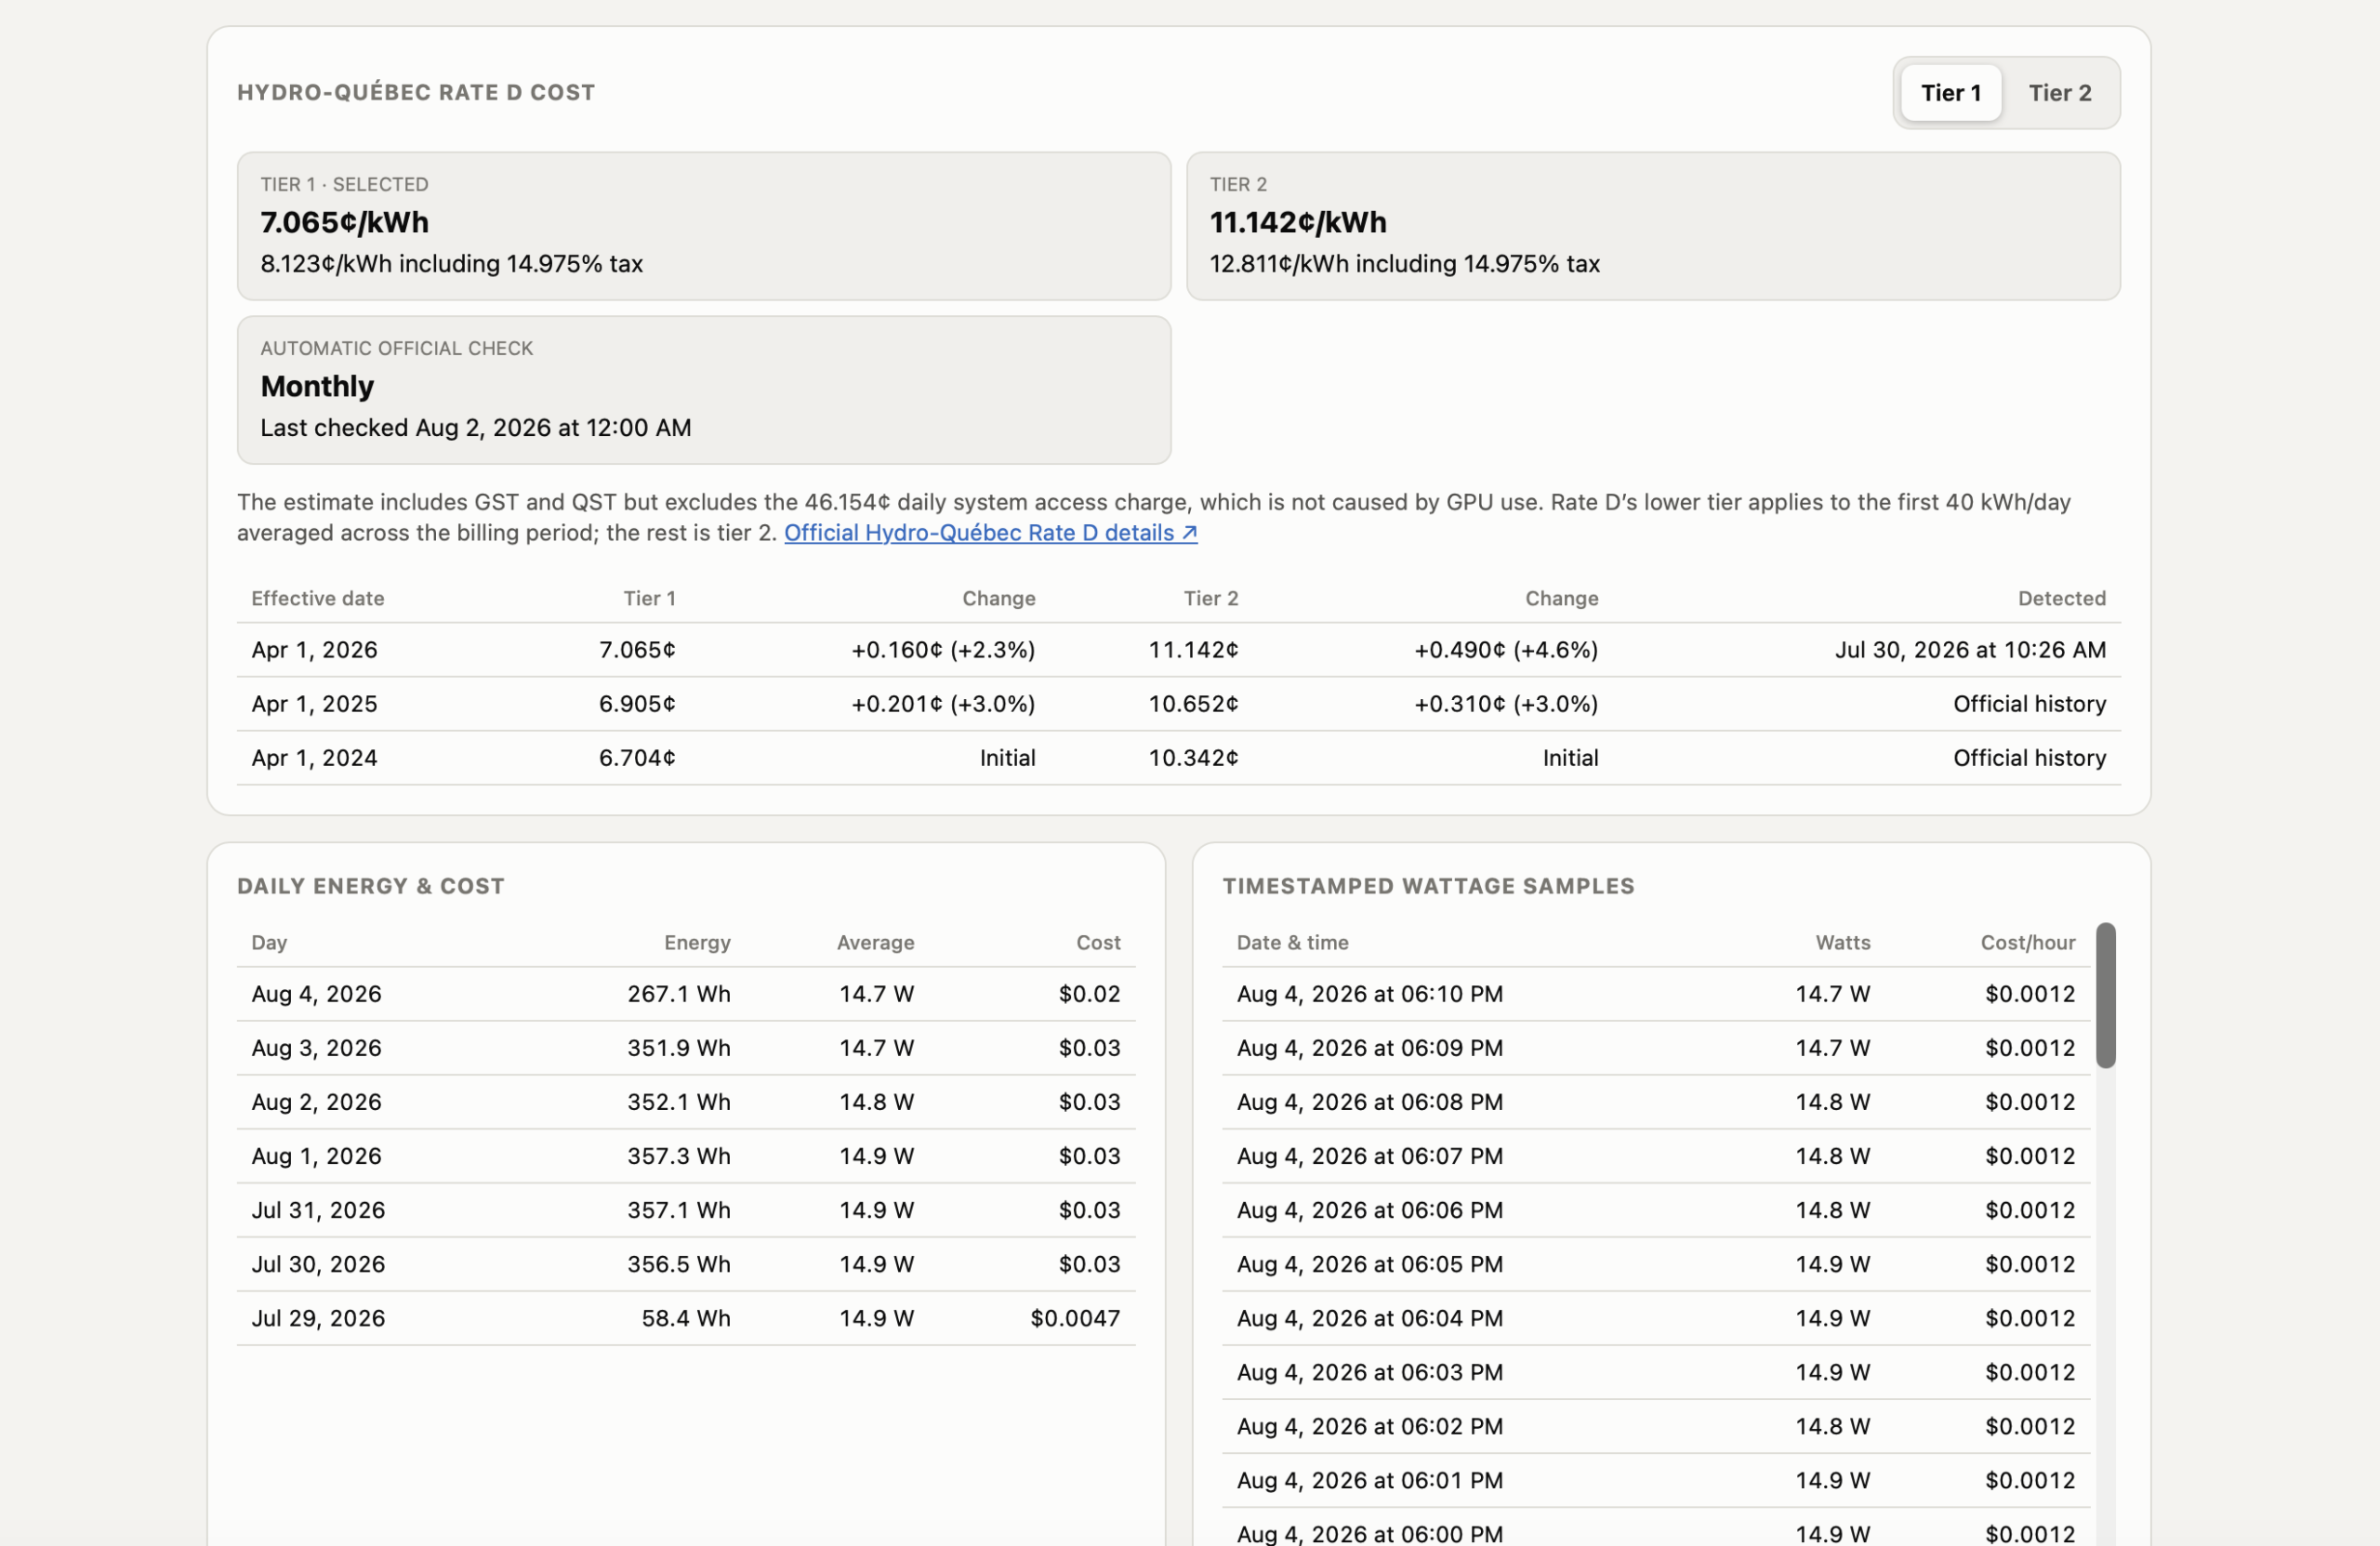
The part I kept coming back to was the GPUs in the NAS. NVIDIA can report the current draw through `nvidia-smi`, so the Pi collects a reading over SSH and stores the samples locally. Those samples become watt-hours over time. The dashboard then estimates a cost using the local electricity tiers.
It is deliberately an estimate. It tells me what the GPU boards are using; it does not pretend to be a whole-home power meter. Being explicit about that turned out to matter more than making the number look precise.
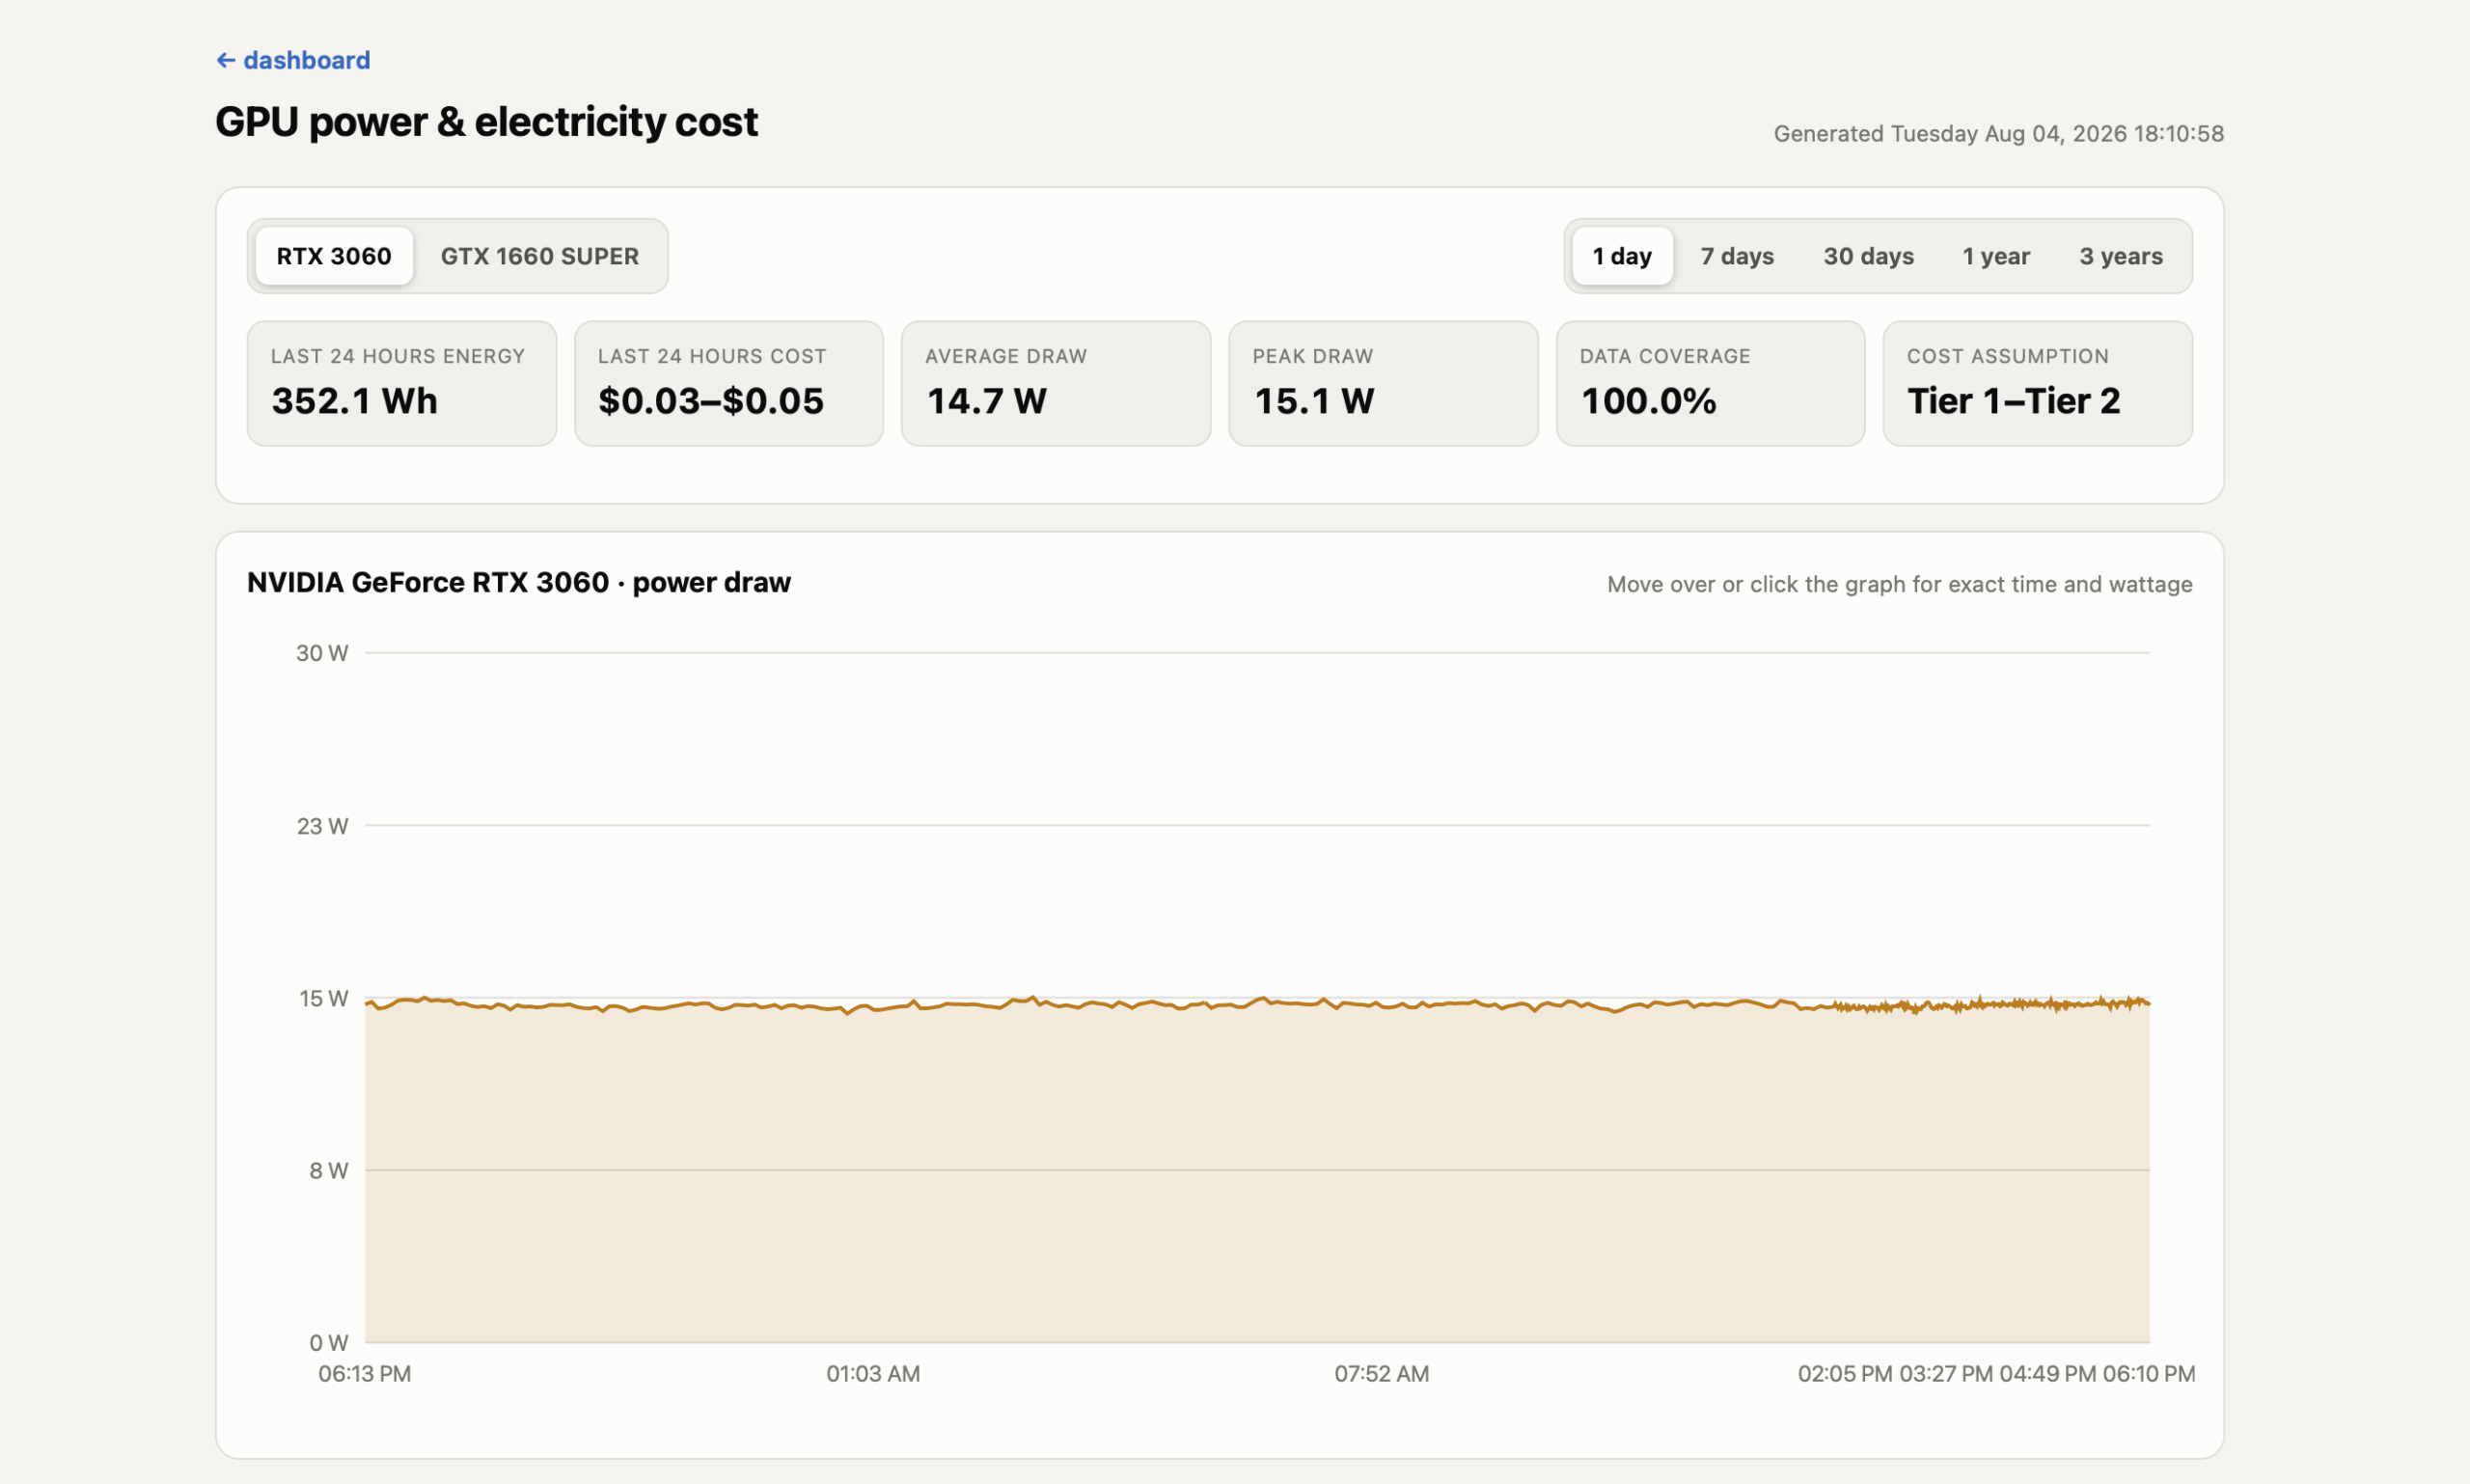
I also added a longer view for the energy data. I can switch between a day, seven days, thirty days, a year, or three years and see the energy, average draw, peak draw, coverage, and a low-to-high cost range. A missing reading is shown as a gap instead of quietly becoming a zero.